

Information on recording device and feature history in HS4, and viewing it as graphs and lists of changes
Added in HS4 4.2.24.6
Overview
HS4 can record the history of your devices and features: every change of their value (a temperature, a dim level) and/or of their status text. You can view that history as a graph and as a list of changes, either for one device on its History tab, or for several devices together on Tools > History.
Recording is turned on for the whole system in Setup, and then chosen for each device or feature you want to follow. Nothing is recorded for a device until you choose to record it.
Global History Settings
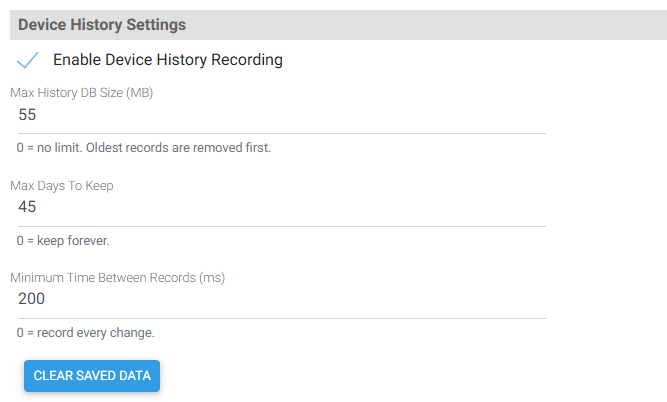
Navigate to Setup and scroll to Device History Settings, at the bottom of the General tab.
-
Enable Device History Recording - Turns recording on or off for the whole system. When off, nothing is recorded, whatever the device settings. On by default.
-
Max History DB Size (MB) - How large the history database may grow. When the limit is reached, the oldest records are removed first. 0 = no limit. Default: 100.
-
Max Days To Keep - Records older than this are removed. Applies to every device that doesn't set its own value. 0 = keep forever. Default: 90.
-
Minimum Time Between Records (ms) - A change that arrives sooner than this after the last recorded change of the same device is not recorded. Useful for devices that report many times per second. 0 = record every change. Default: 200.
-
CLEAR SAVED DATA - Deletes all recorded history, for all devices. This cannot be undone.
Device and Feature History Settings
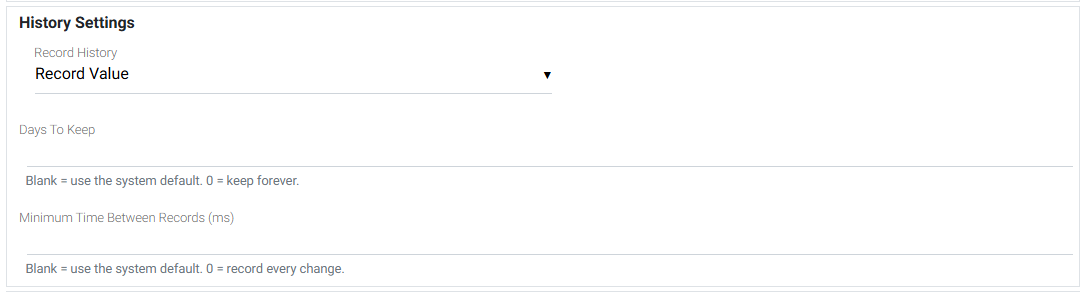
Open the device and select its Settings tab, or select a feature to open its Feature tab, then scroll to History Settings.
-
Record History
-
Do Not Record - No history is kept. This is the default.
-
Record Value - Records the numeric value. Choose this for anything you want to graph: sensors, dimmers, switches.
-
Record Status String - Records the status text set by a plugin or script. It is shown as a timeline.
-
Record Value and Status String - Records both.
-
-
Days To Keep - Overrides Max Days To Keep for this device. Blank = use the system setting, 0 = keep forever.
-
Minimum Time Between Records (ms) - Overrides the system setting for this device. Blank = use the system setting, 0 = record every change.
Click SAVE to apply.
To change several devices at once, tick them in the device list on the Devices page, open Bulk Action and choose one of the History Recording options.
History Tab
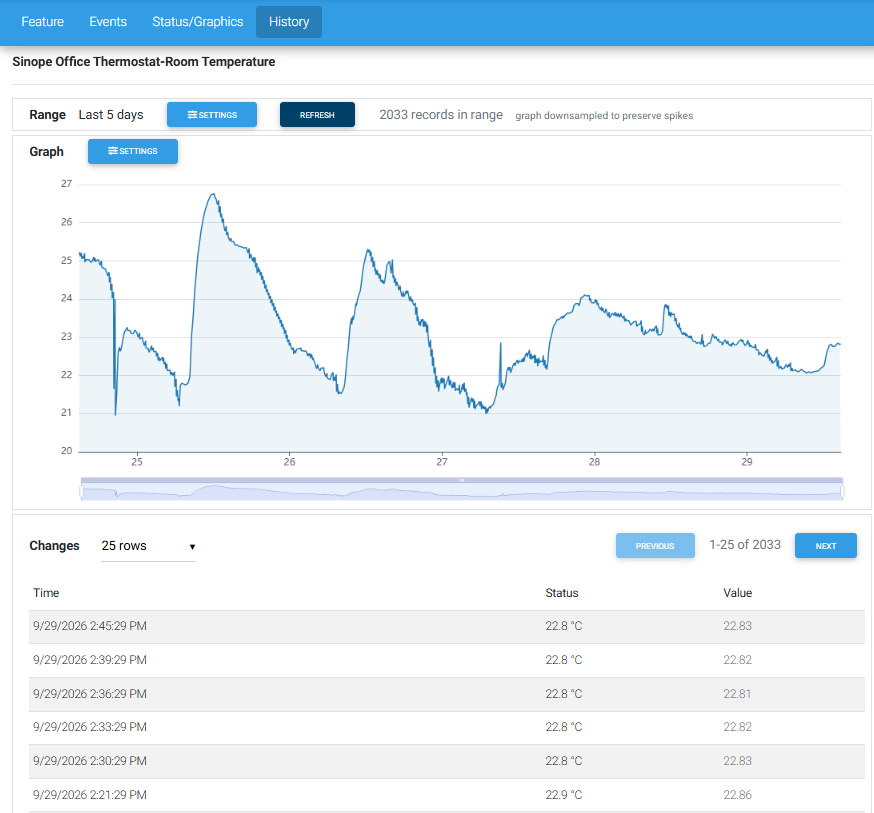
When a device or feature records history, a History tab appears on its page.
-
Range - The period shown. Click SETTINGS to change it, or REFRESH to reload. The range is remembered for each device, in this browser.
-
Graph - The recorded values over time. Hover over the graph to read the value at any moment. Zoom with the mouse wheel (or pinch), and use the slider under the graph to move through the period. SETTINGS opens Graph Settings.
-
Changes - Every recorded change, newest first, with its time, status, raw value and status string. Choose the number of rows per page, and use PREVIOUS and NEXT to browse.
Range Settings
-
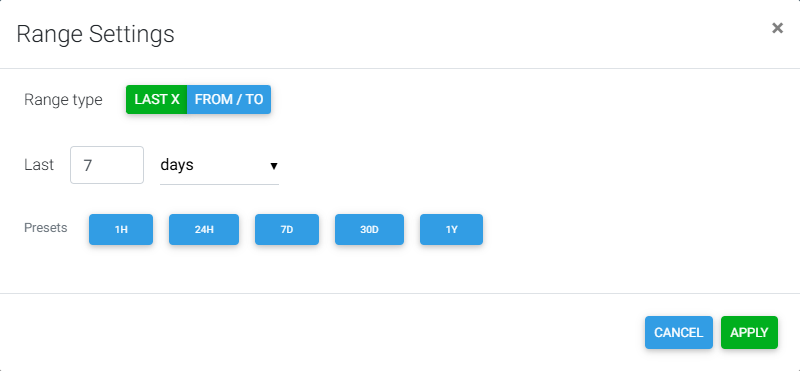
Range type - LAST X shows a period ending now; FROM / TO shows a fixed period between two dates and times.
-
Last - The length of the period, in minutes, hours, days, months or years.
-
Presets - 1H, 24H, 7D, 30D and 1Y apply a common period in one click.
Graph Settings
-
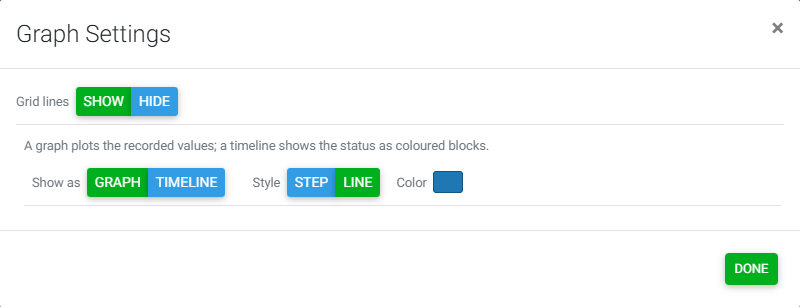
Grid lines - Shows or hides the lines behind the graph.
-
Show as - Graph plots the values against a scale. Timeline shows the status as a band of coloured blocks, one colour per state, which suits doors, modes and anything else with named states. A device that only records its status string is always shown as a timeline.
-
Style - Step holds each value until the next change, which suits switches and levels. Line joins the readings, which suits sensors. The default depends on the type of device.
-
Color - The device's colour on the graph. Default restores the automatic colour.
Tools > History
Navigate to Tools > History to compare up to 10 devices on the same graph. This page requires administrator rights.
-
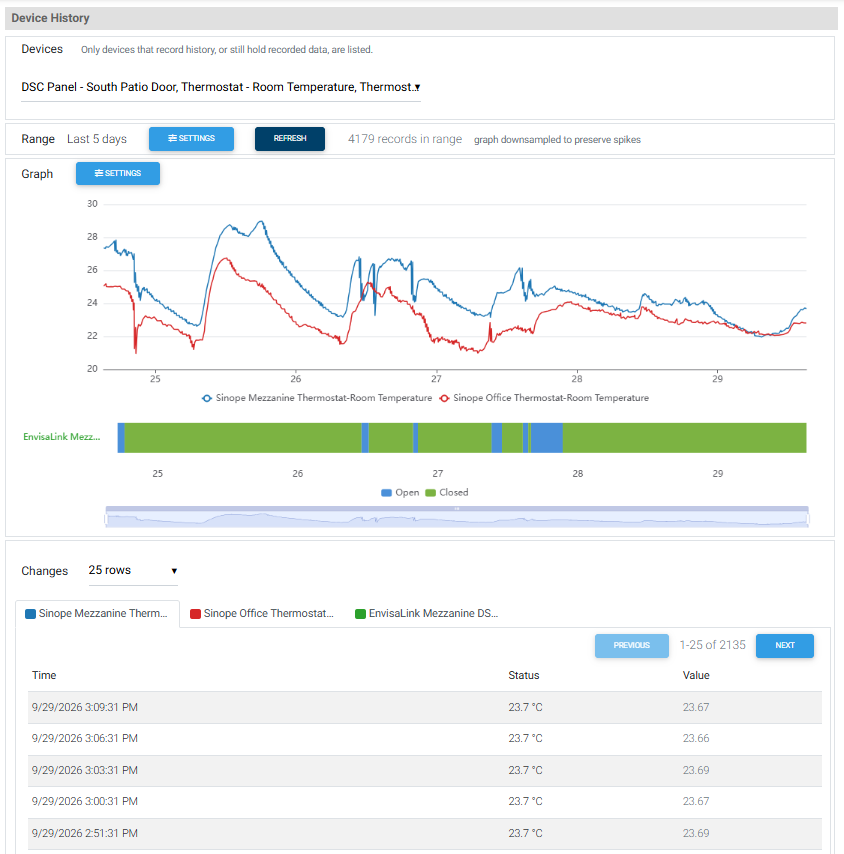
Devices - Open the list, tick the devices to compare, and click SELECT. Only devices that record history, or still hold recorded data, are listed. Type in the search box to filter by name or location.
-
Range - Works as on the History tab.
-
Graph - Each device has its own colour. Graphed values share the top panel, timelines are stacked below it, and a legend names each device.
-
Changes - One tab per device.
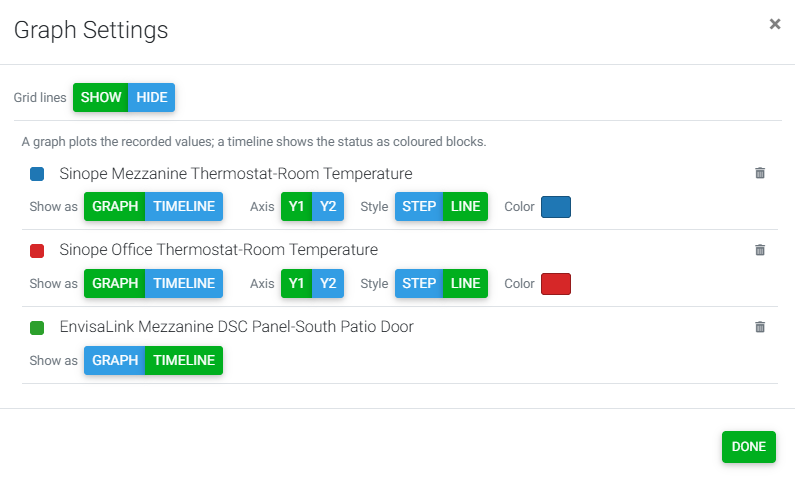
Here, Graph Settings lists every selected device, with two extra controls:
-
Axis - Plots the device against the left (Y1) or right (Y2) scale, so values of different kinds, such as a temperature and a humidity, can share the graph. By default the first device uses Y1, and the others use Y2 unless they report the same kind of value as the first.
-
Trash icon - Removes the device from the graph.
Your selection and range are remembered in this browser.
Notes
-
A graph covering a long period is simplified for display, keeping the peaks. The Changes list always shows every record.
-
Dates and times follow the regional settings of the HS4 system.